When something breaks in production, the first ten minutes usually look the same. One terminal tailing the API pod. Another tailing the worker. A third running kubectl get events -w. Maybe a fourth on the ingress controller, if you can remember which namespace it lives in and what its labels are. Then you start flipping between them, trying to work out what happened first.
That last part is the actual job, and none of the tools help with it. Every terminal scrolls on its own. You find a 502 in the ingress logs at 14:03:12, switch to the backend terminal, scroll up looking for 14:03, overshoot, scroll back down, and by then the worker terminal has moved on. You are reconstructing a timeline by hand, across windows that don’t know about each other, under pressure.
This is the problem Lamplighter is trying to solve.
What it does
Lamplighter is a terminal UI that streams Kubernetes pod logs, events, and ingress logs into columns, side by side, in one view.
lamplighter default/api-pod default:selector:app=worker default:events default:ingress
That’s four columns: a single pod, every pod behind a label selector, the namespace’s event feed, and the ingress controller.
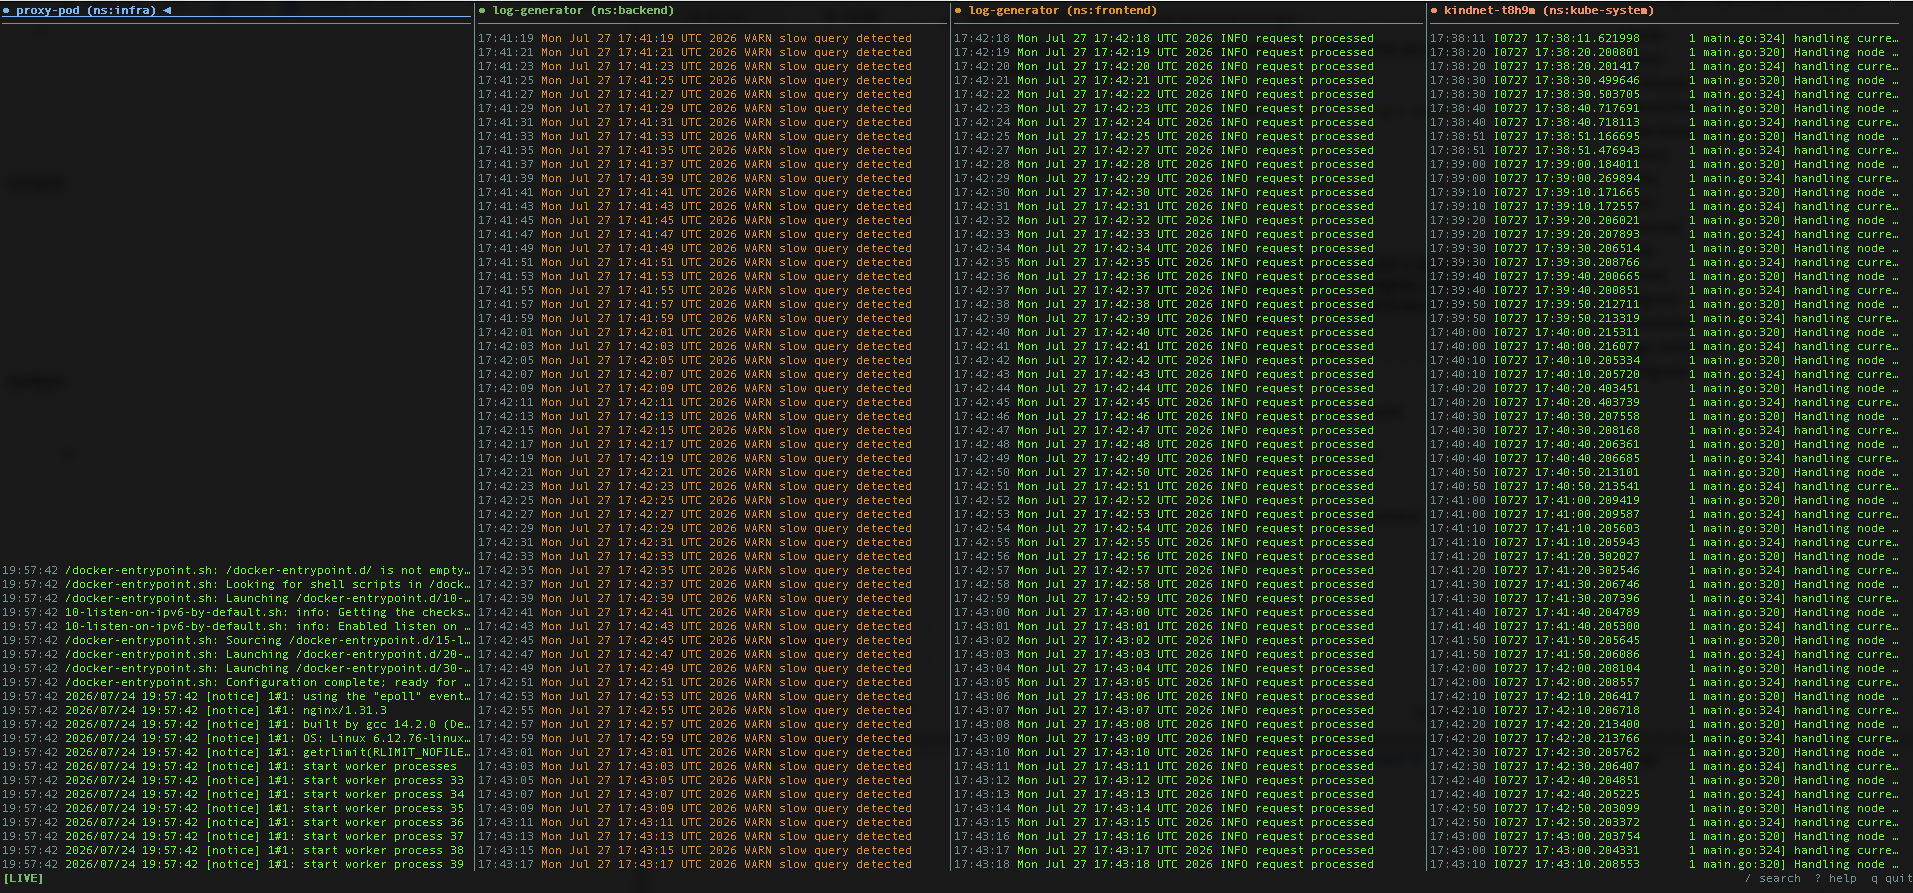 An nginx proxy pod, the backend log-generator showing slow query warnings, the frontend log-generator showing processed requests, and kindnet from kube-system, all in one terminal.
The feature that matters is synchronized scrolling. Press up, and every column moves back to the same point in time. You’re no longer looking at four independent tails. You’re looking at a snapshot of the whole system at 14:03:12: what the ingress saw, what the backend was logging, what the worker was doing, and whether Kubernetes was rescheduling something underneath all of it.
How it fits together
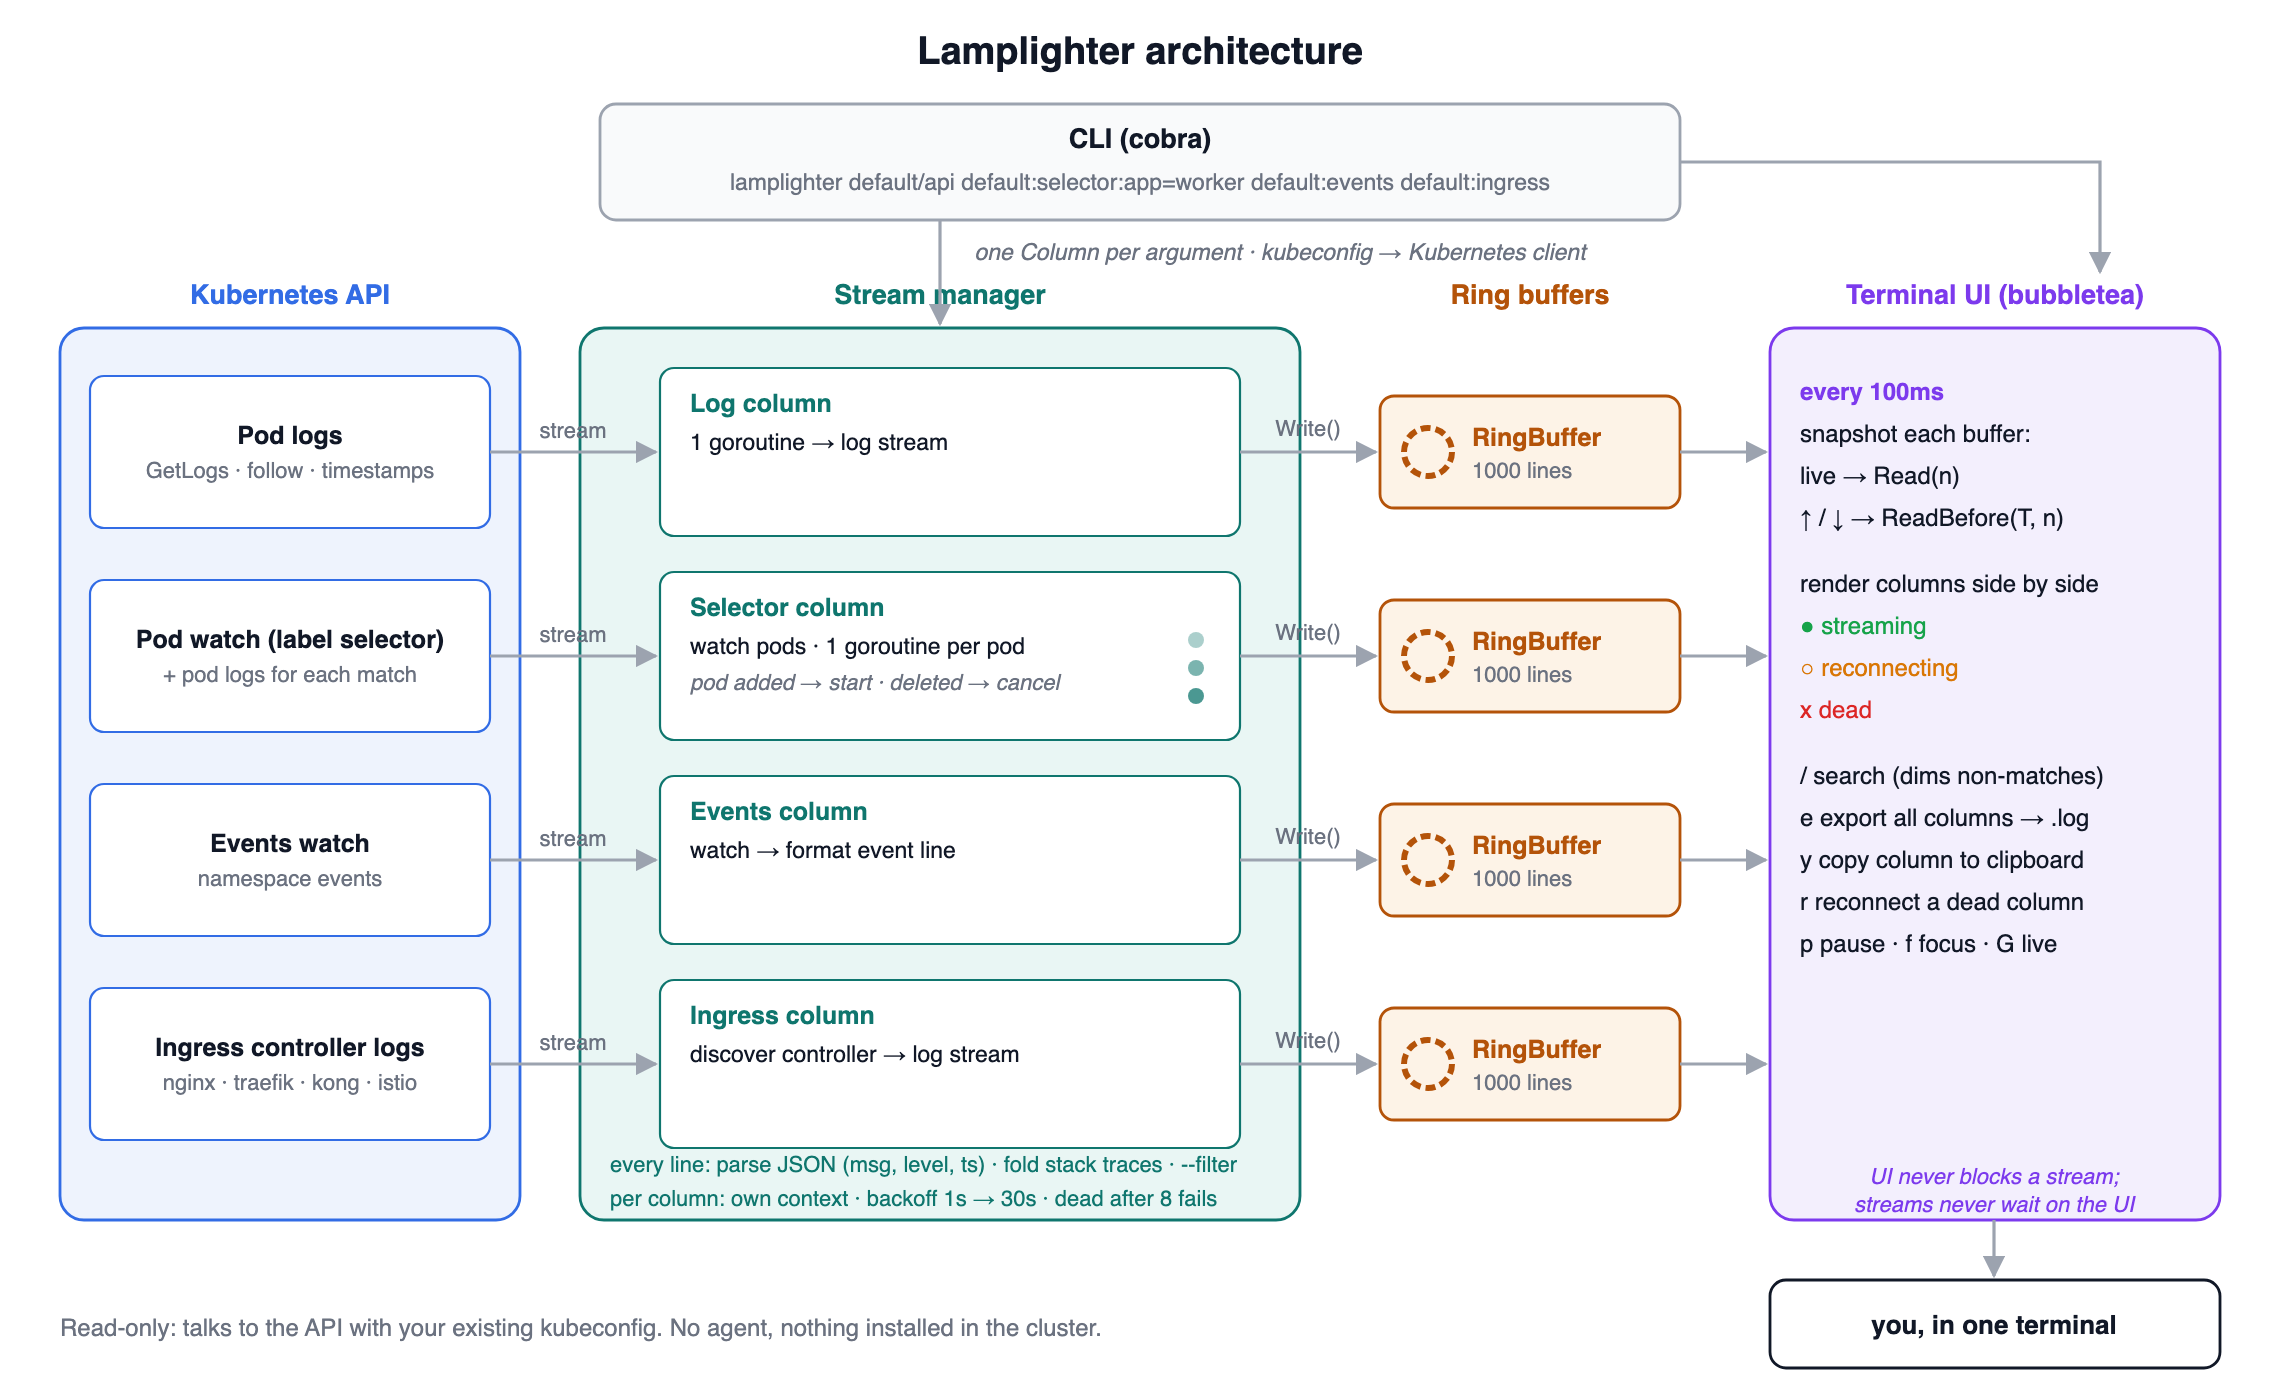 Each column gets its own goroutine, reading straight from the Kubernetes API and writing into its own ring buffer. The UI takes a snapshot of every buffer every 100ms, so a slow stream never freezes the screen and a busy screen never holds up a stream.
How time travel works
Each column writes into its own ring buffer of 1000 lines. Every line carries a timestamp. Lamplighter asks the Kubernetes log API for timestamps on every stream, so even plain-text logs with no timestamp of their own get one.
In live mode, the UI reads the newest lines from each buffer. When you press up, it anchors to the oldest timestamp currently on screen and switches every column to a different read: give me the most recent lines at or before this time. Because every column answers the same question with the same timestamp, they line up.
The scroll step isn’t a fixed number of lines. It’s the time span currently visible across all columns, so one keypress moves back exactly one screen’s worth of time. A chatty column and a quiet one both move by the same number of seconds, not the same number of lines. That’s the difference between scrolling logs and scrolling time. Scroll forward to within two seconds of now and it snaps back to live.
Selector columns follow the deployment
Pod names are the worst thing to type during an incident: they’re random, and they change the moment something restarts. So a column can be a label selector instead of a pod:
lamplighter default:selector:app=api
Under the hood, that column runs a Kubernetes watch on pods matching the selector. When a pod appears, a new log goroutine starts for it. When a pod is deleted, its goroutine is cancelled. Every pod writes into the same column, prefixed with a short form of its name. During a rolling deploy you watch old pods drain and new pods start in one place, which is often exactly when things go wrong.
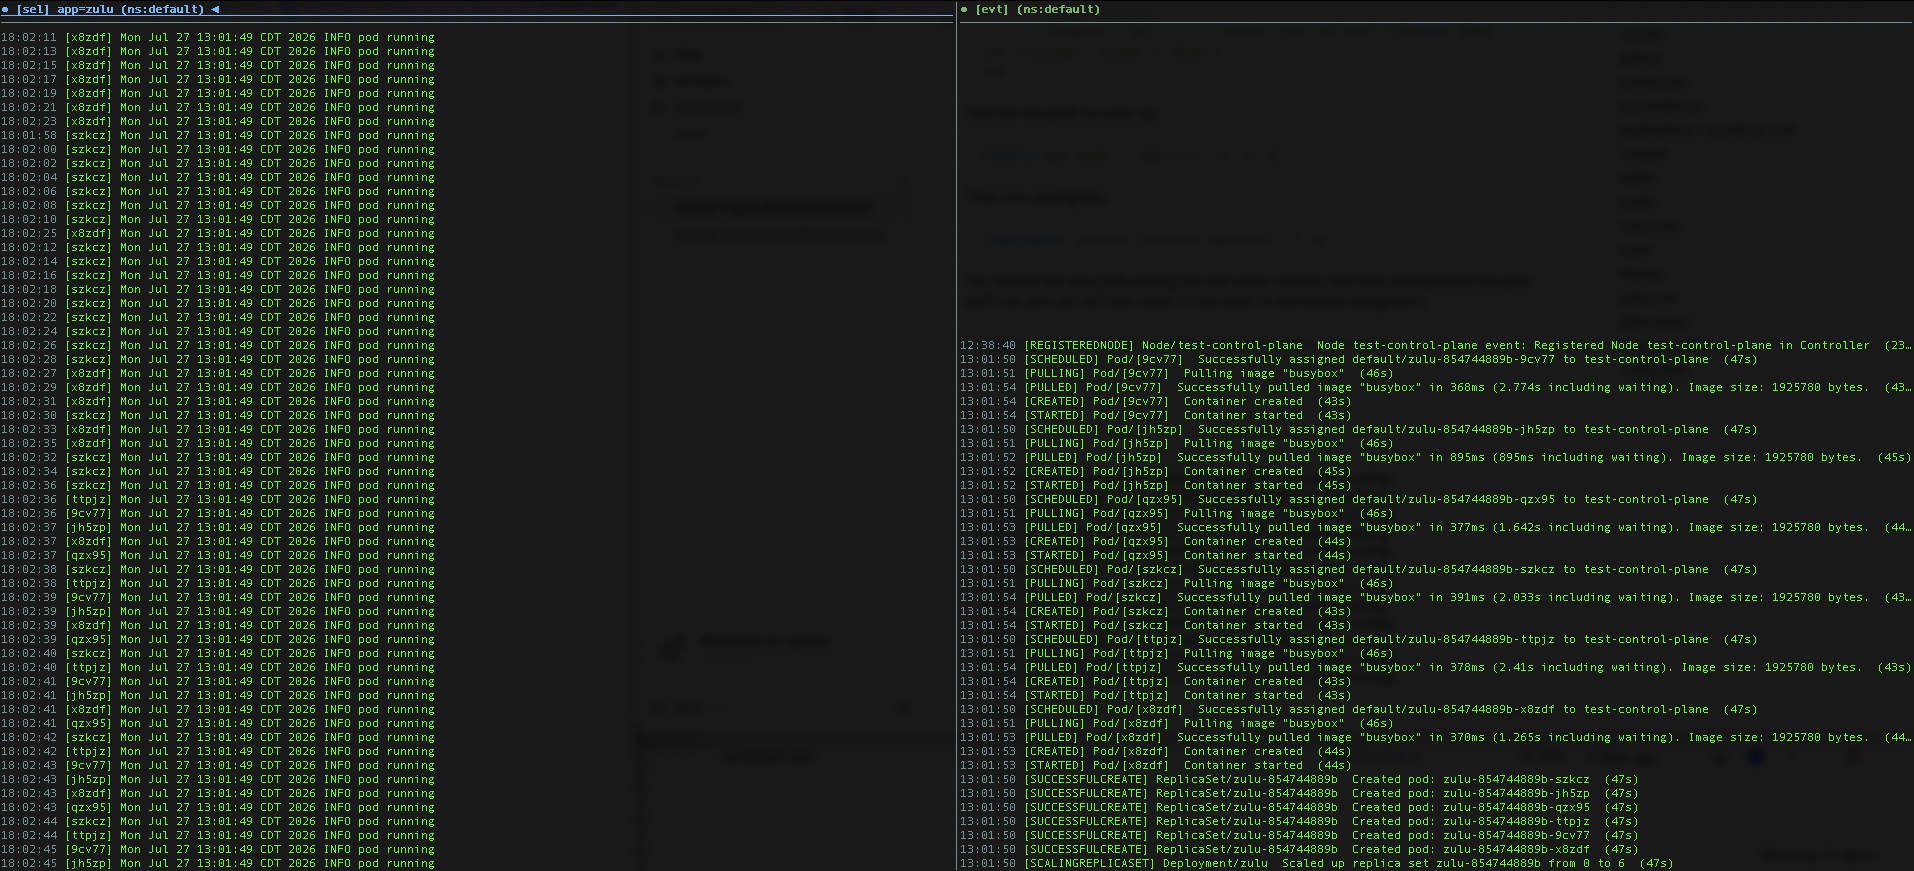 On the left, logs from all six pods in the zulu deployment through one label selector, each line prefixed with its pod. On the right, the namespace’s event feed (scheduled, pulled, created, started) as the deployment scales from 0 to 6 replicas.
The ingress column works the same way, with discovery on top. It looks for the common controllers, ingress-nginx, Traefik, Kong and the Istio ingress gateway, across the namespaces they usually live in, so you don’t have to remember the labels.
Making the logs readable
Every logging library has its own idea of what a JSON log line looks like. zap uses msg and ts, others use message and @timestamp, and level might be level, severity or lvl, with values from ERROR to 50. Lamplighter checks each of the common field names, pulls out the message, level and timestamp, and colours the line by level.
Stack traces are folded under the line that produced them, with a (+N) marker, so one panic doesn’t push the rest of the timeline off the screen.
Search (/) dims everything that doesn’t match. It searches the display text, the raw line, every parsed JSON field and the folded stack traces, so a trace ID buried in a JSON blob still finds the right line.
Staying up when the cluster isn’t
The tool you open during an incident can’t be the thing that falls over. Each column runs in its own goroutine and writes into its own buffer. The UI reads snapshots every 100ms and never blocks a stream, and a stream never blocks the UI.
When a stream drops, the column goes amber and reconnects with exponential backoff, from 1 second up to 30, resetting on success. After eight failed attempts it goes red and stops trying, and r reconnects it by hand. A single pod getting evicted shouldn’t take down your view of the other three.
When you find the thing, e exports every column to a timestamped .log file and y copies the focused column to the clipboard. The timeline you just pieced together can go straight into the incident doc.
“Isn’t this just a log aggregator?”
This was the most common reply when I shared Lamplighter on Reddit, and it’s a fair question. If you have Splunk, or Loki with Grafana, set up well, you can query every service’s logs on one timeline, and you can go back further than any terminal.
But a lot of places don’t have that. Smaller teams and early-stage companies often haven’t set one up yet. Staging and dev clusters rarely get one, because nobody wants to pay to store logs from an environment that’s broken half the time anyway. Splunk is priced on ingest, so plenty of teams that do have it only ship some namespaces, and the one that’s on fire is the one that wasn’t worth the money. On-prem and air-gapped clusters may have nothing at all. Even with a good aggregator, Kubernetes events usually aren’t in it unless someone installed an exporter for them, and the API server only keeps them for about an hour by default.
What every one of those environments does have is kubectl access, and that’s all Lamplighter needs. It reads straight from the Kubernetes API with your existing kubeconfig. There’s no agent to deploy, nothing to install in the cluster, and nothing to pay for. It also has no ingestion pipeline sitting in between, so it can’t lag behind or be the thing that’s down during the incident.
So no, it isn’t a log aggregator, and it isn’t trying to be one. If you have a good aggregator, use it. Lamplighter is for when you don’t, or when the logs you need aren’t in it.
What it won’t do
It only sees what’s in the cluster right now, up to 1000 lines per column. If the pod is long gone, so are its logs, and that’s when you do need an aggregator. There’s no brew install yet, and no deployment shorthand: you need to know the label selector. Selector columns put every pod into one shared column rather than splitting them out, and there’s no config file, so it’s all flags every time.
Lamplighter isn’t trying to replace your observability stack. It’s for the first ten minutes, before you know which dashboard to open: the part where you’re in a terminal, the cluster is on fire, and you need to know what happened, in what order.
The code is on my Github.
The name comes from John le Carré. In Tinker Tailor Soldier Spy, the Lamplighters are the Circus section that runs surveillance: they watch, they follow, and they report what they saw and when. They don’t run the operation. They just make sure the people who do know what happened. It felt right for a tool that watches every corner of the cluster at once and hands you the timeline.